I have been a semi-frequent Formula 1 fan since I could see with my eyes. Ever since a kid in the early 2000s, I recall my dad tuning in on every race weekend and sitting on the couch watching the Sunday’s race with him. In recent years, with for example Netflix’s wildy edited F1 documentary series and Brad Pitt’s F1 movie, the sport has experienced a huge audience boost. Watching all the weekend events live in Finland requires a 40€/month subscription, so I’ve opted for watching the events for free from YouTube. F1 officially posts solid 4-8 minute highlights from the race, qualifying and all three practice sessions. I highly recommend this strategy if you want to get into the world of F1.
Today however, we aren’t discussing F1 race streaming options or Brad Pitt’s acting skills. We will take a focus on the real drivers and their ages! Interesting, I know right!
Note: This is not really a discussion about the results of my analysis but more of a journal of the data science project.
Need a tl;dr just about the results? Jump to the plot from here.
Introduction#
Lately, as I’ve been going through all sorts of crises regarding my age, I started thinking about the current drivers of the Formula Circus. I had a feeling the drivers’ ages had went down dramatically from say 20 years ago. On the current grid the younges driver is the newbie Arvid Lindblad, who’s about to turn 19 in just a few weeks. Current championship leader Kimi Antonelli will also turn 20 in August. Overall, from the current grid, 8 out of 22 drivers are 25 years old or younger. I could swear when I was a kid there weren’t kids like this driving in F1. The grumpy old men like Michael Schumacher had wrinkles and they all had been driving since the 80s or something! I swear!
On the other hand, this “phenomenon” could just be due to me getting older myself. I’m just seeing drivers significantly younger than myself. When you’re 27, it is no surprise people younger than you aren’t kids anymore! And neither are you.
So the question had to be asked.
How different are the drivers’ ages currently, compared to earlier times?
Conducting the analysis#
I realize this is a subject that has most likely tickled the minds of quite a few data science F1 fans already, but I wanted to conduct my own analysis from the very beginning. I did not even bother to search for datasets available online regarding drivers and their ages. To be able to obtain results worth standing behind, one needs to know the input data inside out. What better way to achieve this than by gathering the data myself?
Gathering the data#
Before I could even start to collect my input data, I realized I had to make some strategic decisions. Firstly, an F1 season takes almost the entire year and naturally the birthdays of drivers are quite evenly distributed along the year. If I wanted to inspect driver ages and compare for example the average ages of different years, I would need a specific point in a year to calculate the birthdays from. Thus the ideal situation would be to take a specific date somewhere along the race season and calculate ages from it.
Picking a specific race weekend and location for the date requirement was almost a bit difficult. Just this year, we have seen quite a lot of fluctuation in races due to the global political atmosphere and races are being cancelled left and right. New venues are being introduced in all kinds of parking lots (yes I’m throwing shade at the Miami Grand Prix) and old ones are scrapped due to all sorts of financial issues. Earlier this year it was introduced that the Barcelona-Catalunya GP would start alternating in the race calendar with the Belgian GP. With the current direction we won’t soon have too many staple race weekends on the calendar.
After a brief moment of panic I of course remembered the ever so legendary Monaco GP. Everyone knows the historic street circuit which might even be the highlight of the season for some. The answer to my problem lay directly in the word “historic”. Monaco GP was first driven all the way back in 1929! Obviously there weren’t consecutive race years due to all kinds of World Wars and financial troubles, but after a bit of research I found that the Monaco GP was organized every year starting from 1955, going all the way to 2019 (then a quick Covid break in 2020) and continuing 2021-2026. With this information, my data gathering efforts focused solely on the Monaco race weekends of years past.
After a bit of good old web surfing and checking some sites for driver data, it was clear Wikipedia had the most consistent results. I opted for using Sunday’s race results as opposed to qualifyings or other available data tables.
Now, Wikipedia doesn’t exactly allow automated web scraping or bots of any kind. If you make a request to a wiki page without proper user agent headers, you will be greeted with strict instructions on what kind of automation is allowed. This is of course understandable, with the limited resources of a nonprofit organization. For legal purposes I will now state that I did not operate any kind of automated scripts to obtain data from Wikipedia. This text includes descriptions of a hypothetical situation on what I would have done if I wanted to obtain some F1 data.
Race results#
The first part of the data gathering process was to collect and save the race result tables. Wikipedia is such a beautiful thing since every single race had the following URL structure: https://en.wikipedia.org/wiki/{year}_Monaco_Grand_Prix. This made the request loop very simple. The basic structure was as follows:
- Loop through race years, remembering to skip 2020
- Request the wiki page of a year and parse it
- Search and extract the correct table element
- Parse the table and convert it to a Pandas dataframe
- Save the dataframe to a CSV file
I used the industry standard library Beautiful Soup to parse the requested HTML file. Discovering the table element required some trial and error. The final solution was a bit ugly as I had to hard-code the element selection based on the file structure, since the race result table did not have any identifying class or id attributes. Below is the main code, after requesting the correct page (which I did not do for legal reasons).
soup = BeautifulSoup(response, 'html.parser')

# I think this is the best way to find the right table
race_header = soup.find('th', string=table_identifier)
# Seems sketchy but I believe the table structure is always same
try:
    race_table = race_header.parent.parent.parent
except AttributeError:
    print("Correct table not found, skipping")
    with open('error_years.txt', 'a') as file:
        file.write(str(year) + '\n')
    return
As you can see, I created a stupidly simple error handling mechanism where I just logged the years of the loop where the table was not found into a file. Then on later runs I could just get a list of years from the error file and loop through those to request the HTML files for parsing.
In order to be a law-abiding citizen, I added a time.sleep(random.randint(16,22)) block into the request loop, so I would not be banned from Wikipedia, in case they had some automation detection tool running.
After discovering the correct table, I did some simple string stripping and saved the table as a CSV file. And before you knew it, I had a directory of 71 CSV files containing the race results.
The CSVs were far from perfect though, as for example in the 50s a single car might have had two drivers that shared the race result, so my tables had driver columns with names like ‘Jean Behra Cesare Perdisa’. Also, due to my simplistic string stripping, some Wikipedia footnote markers found themselves in random cells. For example Juan Manuel Fangio apparently got 11 points from the 1955 race despite having to retire his car. In reality he got one point which had a footnote about driving the fastest lap of the race. Thus some files obviously required some manual intervention but the problems decreased quite soon after the first decade.
Birthdays and ages#
The next step was to connect the drivers with their birthdays first and finally their age on the race day. This required a lot more code than just obtaining the race tables. Ultimately, the rough structure I created was as follows:
- Extract year from CSV file name using regex
- Request the current year’s race wiki once more, parse the file and save the exact race date
- Convert race CSV to Pandas dataframe (maybe not necessary)
- Loop through drivers in the dataframe and request + parse their wiki page to get the birthday
- Calculate driver age in years based on their birthday and race day
- I opted to use a yearly accuracy rather than years + months + days to keep the analysis more simple
- Add age to race dataframe
- Save dataframe as a new CSV
Additionally, I created a simple but beautiful cache system for the drivers’ birthdays (and in the end also for race days) in order to minimize the requests made to Wikipedia. As most of the drivers were multi-year racers and they attended multiple Monaco GP events, I could retrieve their birthdays from the cache when calculating ages in later races after the first one. This was done as follows:
def get_birthday(self, person: str) -> str | None:
    print(f'Retrieving birthday of {person}')
    person_url = person.replace(' ', '_')
    sleep_time = random.randint(8,14)

    # Attempt to request page for driver
    try:
        time.sleep(sleep_time) # Sleep before request
        response = requests.get(f'https://en.wikipedia.org/wiki/{person_url}', headers=request_headers)
        response.raise_for_status()
        response_text = response.text
        soup = BeautifulSoup(response_text, 'html.parser')
    except requests.exceptions.HTTPError:
        print(f'Error: Wiki page not found for {person}')
        # Log problematic person
        with open('error_persons.txt' ,'a') as f:
            f.write(person + '\n')
        return

    # Attempt to search birthday element from page
    try:
        bday_string = soup.find('span', class_='bday').get_text()
        # Save bday to cache
        self.bday_cache[person] = bday_string
    except AttributeError:
        print(f'Error: Birthday element not found for {person}')
        # Log problematic person
        with open('error_persons.txt', 'a') as f:
            f.write(person + '\n')
        return

    return bday_string

# Check if bday already retrieved or call get_bithday
def retrieve_birthday(self, person: str) -> date | None:
    if person in self.bday_cache:
        print(f'Found {person} in cache.')
        bday_string = self.bday_cache[person]
    else:
        bday_string = self.get_birthday(person)

    # bday_format_visual = "%d %B %Y"
    bday_format = "%Y-%m-%d"
    if bday_string:
        try:
            bday = datetime.strptime(bday_string, bday_format)
            return bday
        except ValueError:
            print(f'Failed to convert birthday to date object, given date was {bday_string}')
            # Log problematic person
            with open('error_persons.txt', 'a') as f:
                f.write(person + '\n')
            return
    else:
        return
Then with quite extensive error handling through try-except blocks, I could catch problems, dump the caches to JSON files, log where the error came from and exit the excecution gracefully if needed.
I decided to use a class structure for the ’extractor’ in order to keep track of and properly update the cache state.
I used a similar error logging system for the drivers as I did in the first part for the race years. If a birthday element was not found for a driver, their name was added to an error file and I could inspect what the problem was manually. Mostly these errors stemmed from having multiple people with the same name so requesting wiki/{driver} did not work as the correct URL was wiki/{driver}_(racing_driver).
Then since I had to run the loop multiple times due to problems and logic improvements, I could use the cached birthdays, race days and driver errors to again limit the needed requests.
Analyzing the data#
The last step of my project was the simplest. I decided to use a local instance of a Jupyter Notebook to conduct the actual age analysis. It was a simple snippet of code:
- Loop through the CSVs
- Calculate mean ages per year, save to a list
- Construct the graph using matplotlib and a custom theme
Playing around with the graph was possibly the best part of this step. Ever since my first university courses, I have been trying to perfect my graphing skills and steer as far away as possible from the default pyplot graph style. Since this was the first time I used a Jupyter Notebook after graduation, I decided to really go into town with the graph styling. After some more googling, I found a few solid contenders from this Medium post. The one I chose for this project was the matplotx package which extends Matplotlib’s styling capabilities. I highly recommend you to visit and read through both links! The days of boring graphs are over!
Below is the code I used to generate the plot found in Results.
plt.style.use(matplotx.styles.nord)

years, vals = zip(*means)
years = [int(x) for x in years]

plt.figure()
plt.plot(years, vals)
plt.xlabel('Year')
plt.xticks(no.arange(1955, 2027, 5))
plt.ylabel('Age avg')
plt.yticks(np.arange(25, 37, 1))
plt.ylim(25, 37)
plt.grid()
plt.title('Driver Age Analysis (1955-2026)', fontweight='bold')
plt.show()
The Results#
By conducting rigorous ground work in constructing the datasets, the analysis was easy to complete and the results are stupid-simple.
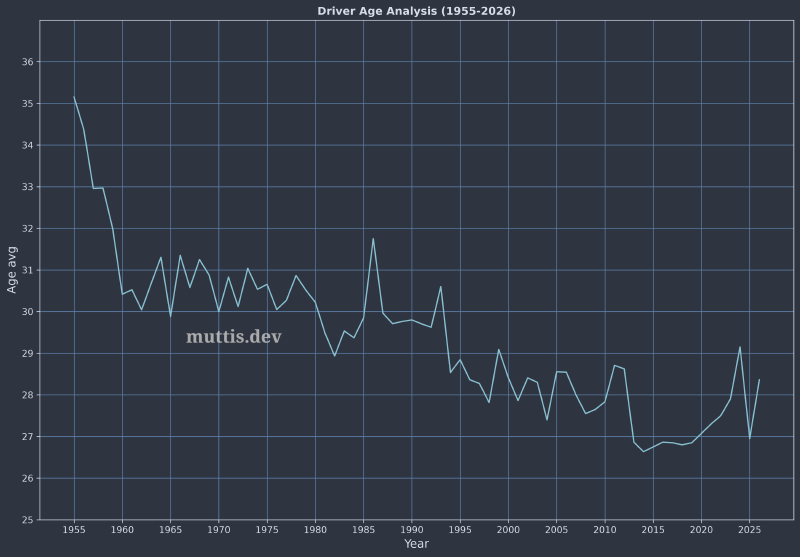
The above figure finally shows the result I’ve been yapping about for a few hours. The curve is indeed coming down from the 1950s. Note the age range in the y-axis, which might give an overly dramatic effect to the curve.
The figure shows a dramatic drop right in the beginning, with the mean age dropping from 35 to 30 in just 5 years. Then, a beautiful, almost 20-year relatively flat spot between 1960 and 1980. In the 80s there was big fluctuation, with the age dropping significantly below 30 for the first time, until the 90s when the sport apparently went through a big change and the mean driver age went permanently under 30. During the 2000s the mean age has been more flat again, going over and under 28 years with some minor fluctuation.
Regarding my hypothesis of drivers getting younger in the grid, I was kind of right. But the hypothesis stemmed from my experiences in watching the races in 2000s, where the ages actually didn’t fluctuate so much. So my thinking was indeed skewed by the fact that I’ve gotten older myself.
The 2000s have definitely seen the youngest starting grids in Monaco. The absolute youngest grid in Sunday’s race in Monaco was in 2014 with an average driver age of 26.6 years. We must also not forget everyone’s favorite unc drivers in the current grid, Lewis and Fernando. Their presence is obviously bringing the current grid age quite high.
It will also be interesting to see what direction the curve takes in the future, with the slight upward trend in the 2020s.
Final Words#
To sum things up, we took a brief look into how F1 drivers ages have fluctuated over the past 8 decades. I took you through constructing the required datasets and briefly discussed my results. In the end, we did learn that the average age has come down from 35 all the way down to 26 in 2014 and slightly back up to 28.4 in 2026.
I still haven’t checked online but I think I’m not the first person to create this analysis. Nevertheless, it would be cool if someone ended up on my blog reading about my approach. If you made it this far, thank you for reading and apologies if my storytelling was a bit all over the place…
This project clearly consisted of two separate stages: writing scripts to create the datasets and then using a notebook approach to conduct the analysis. The stages are not directly comparable since the analysis part was so short but I must say I enjoyed the first stage a lot more. Figuring out the required logic and how to avoid errors was a rewarding process and I enjoyed every bit of it, including the debugging. Using the notebook and writing simple code statements to cells was almost too clean and, as I’ve thought for years already, it doesn’t really feel like ‘coding’.
Does this mean I’m more of a software engineer than a data scientist? Maybe. But please, don’t share this notion with my employer.
What other kind of analysis could still be conducted?#
After creating such beautiful datasets, one must wonder what else could the data be used for. Many ideas popped to my head but for now, I think I have (hypothetically) done enough Wikipedia requests and need to start looking at other kinds of projects.
A list of what could still be done with the data:
- Find out fastest lap times and compare those with average driver ages
- Note that the lap lengths are not the same each year so more requests are needed!
- Add driver nationality to the data and see how that plays with ages etc.
- Use the championship points and see how ages affect them
If there is interest, I could publish the datasets for the world and for other people to use.
AI disclaimer#
For complete transparency in the age of AI generated slop and click farming, I want to state the usage of AI in this blog post.
The text is completely written by me and only me. No kind of reformatting or rewording has been done using AI tools. For the analysis, I googled a lot of instructions on using the libraries I needed. I visited mainly Stack Overflow discussions and GeeksForGeeks tutorials to get my code working. However, some simple answers to my problems were taken from the AI Overview. For example the basic syntax to do row-wise operations in a Pandas dataframe.
Despite reading some of the instructions from the AI Overview, neither the code in the script nor the analysis notebook was generated by AI and I did not open a single discussion with a chatbot of any kind.
Thank you for reading my post!
Unfortunately leaving feedback is not yet possible. I need to decide if that is necessary for my tiny blog.